 Itnetic Technologies
Logs & analytics
See every request. Prove every block.
A live, per-request view of what we let through and what we stopped — with the exact rule, fingerprint and TLS details behind every decision.
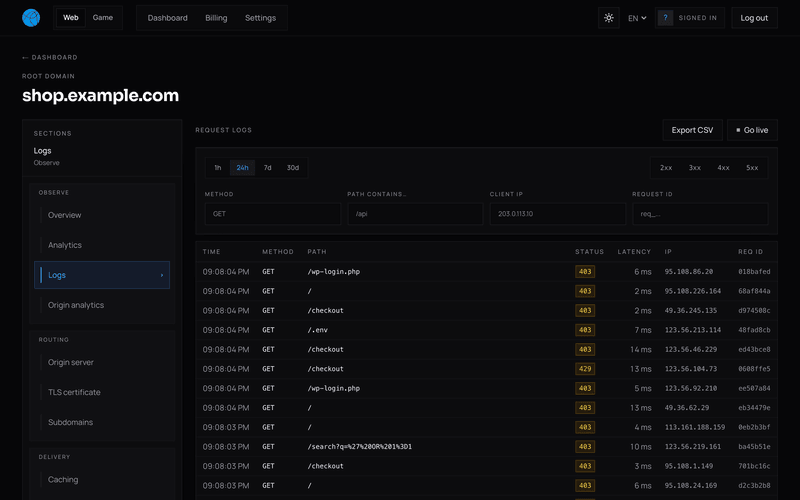
Request logs
Every request, fully attributed
Time, method, path, status, latency and request ID for every hit — expand a row for the TLS details, client fingerprint and the WAF verdict behind it.
- Filter by status class and time window in a click.
- Copyable request IDs tie a log line to a support conversation.
- Audit-ready: show exactly what hit you, when, and what stopped it.
Analytics
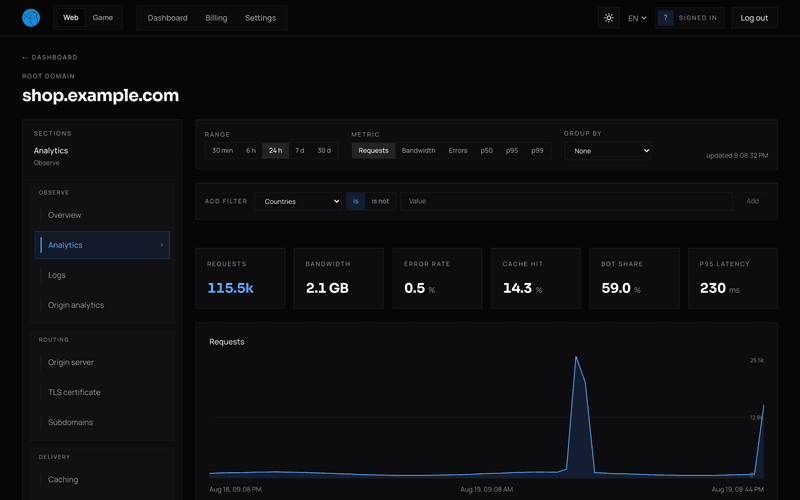
Traffic and errors at a glance
Requests, errors, cache hit rate and transfer over your chosen window, so a spike is obvious the moment it starts.
- 24-hour, 7-day and 30-day windows.
- Peak and average annotations on every series.
- Data-transfer totals that never count scrubbed attack traffic.
Attack timeline
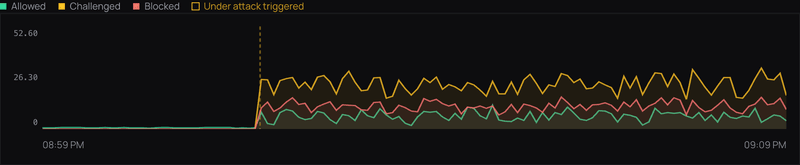
Watch mitigation kick in
A live timeline splits traffic into allowed, challenged and blocked, and marks the moment under-attack mode triggered.
- Allowed, challenged and blocked, second by second.
- A marker on every automatic under-attack trigger.
- The same signal that powers real-time Discord alerts.
FAQ
Questions?
How far back do logs go?
Recent requests are available live in the dashboard; analytics roll up over 24-hour, 7-day and 30-day windows.
Can I see why a request was blocked?
Yes. Every blocked request shows the exact WAF rule and verdict, plus the TLS and client-fingerprint details behind the decision.
Does blocked traffic count against my bandwidth?
No. Analytics separate legitimate traffic from scrubbed attacks, and only delivered traffic is metered.